Industrial plants rely on thousands of valves to control flow, pressure, and safety across critical processes. As operations grow more complex, the need for valve monitoring dashboards has become essential for operators, engineers, and maintenance teams. These digital interfaces provide instant access to valve health, status, and performance data, enabling better decision-making and minimizing unplanned downtime.
Today’s dashboards offer far more than simple status indicators. They aggregate data from sensors, controllers, and analytics platforms, presenting actionable insights in a clear, visual format. By integrating these tools, facilities can achieve greater transparency, improve safety, and optimize maintenance strategies. For those seeking to enhance their plant’s operational intelligence, exploring valve monitoring instrumentation tools is a practical first step toward building a robust digital infrastructure.
The Role of Valve Monitoring Dashboards in Modern Plants
Digital dashboards dedicated to valve oversight have transformed how facilities manage their assets. These platforms consolidate information from diverse sources, including smart sensors, programmable logic controllers (PLCs), and enterprise asset management systems. The result is a unified view of valve conditions, operational trends, and potential issues—all accessible from a single screen.
Key benefits include:
- Real-time visibility into valve positions, open/close cycles, and alerts
- Early detection of abnormal behavior or wear patterns
- Centralized access to maintenance history and diagnostic data
- Improved coordination between operations and maintenance teams
By leveraging these dashboards, plants can move from reactive to proactive maintenance, reducing the risk of costly failures and ensuring compliance with safety standards.
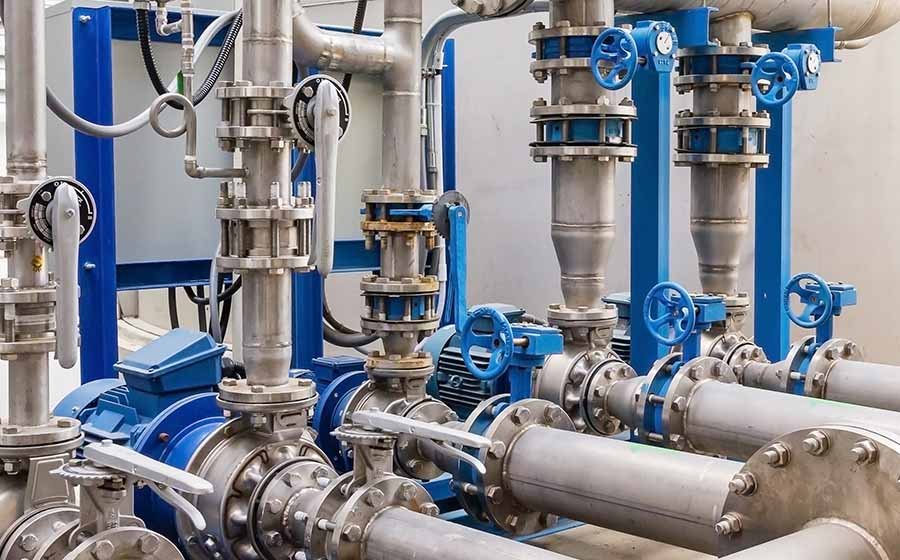
Key Features of Effective Valve Monitoring Interfaces
Not all dashboards are created equal. The most effective solutions share several core features that maximize usability and value:
- Customizable layouts that allow users to prioritize the most relevant data for their roles
- Interactive visualizations, such as trend graphs and heatmaps, to highlight anomalies and performance shifts
- Integration with advanced valve analytics systems for predictive maintenance and deeper insights
- Automated alerts and notifications for critical events or threshold breaches
- Mobile compatibility for remote monitoring and field access
These capabilities empower teams to identify and address issues before they escalate, minimizing unplanned outages and optimizing resource allocation.
How Real-Time Data Enhances Plant Visibility
Access to up-to-the-minute information is the foundation of operational excellence. With real-time valve monitoring dashboards, plant personnel gain immediate awareness of system health, enabling faster response to deviations and emergencies. Live data streams can include:
- Valve position and actuation times
- Pressure, temperature, and flow readings at key points
- Diagnostic codes and self-test results from smart actuators
- Historical trends for performance benchmarking
Combining these data points with predictive algorithms—such as those found in valve anomaly prediction models—enables plants to anticipate failures, schedule maintenance efficiently, and extend asset lifespans.
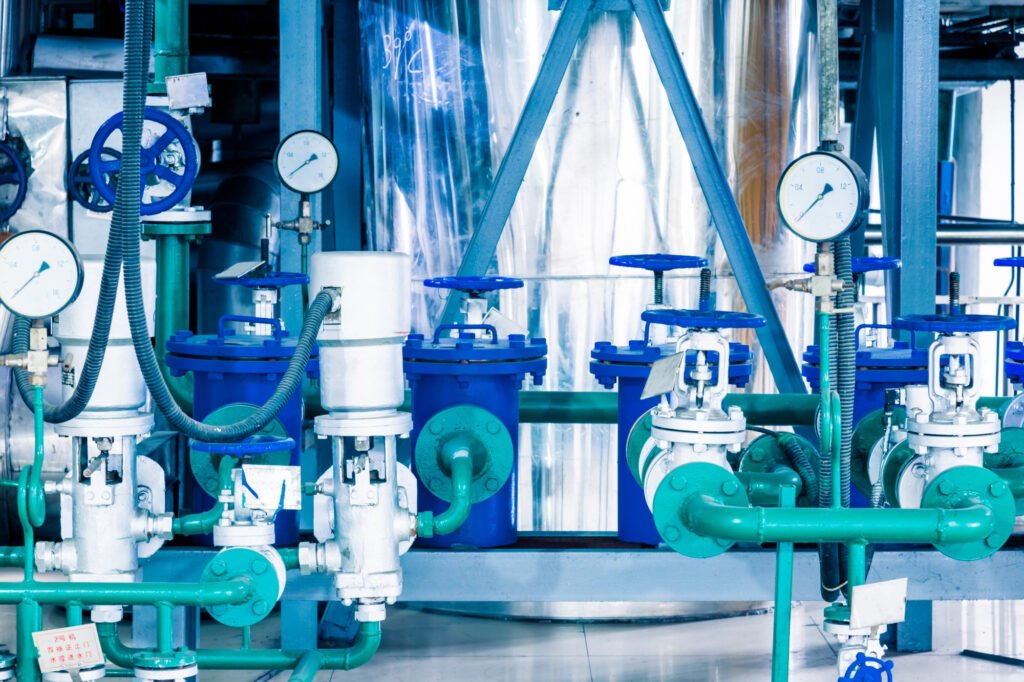
Integrating Dashboards with Plant Systems
For maximum impact, monitoring interfaces should seamlessly connect with existing plant infrastructure. This includes:
- SCADA (Supervisory Control and Data Acquisition) systems for overarching process control
- Asset management platforms for maintenance scheduling and recordkeeping
- Data historians for long-term trend analysis
- Cloud-based analytics for remote access and advanced processing
Such integration ensures that valve data is not siloed but instead contributes to a holistic view of plant performance. For example, combining dashboard insights with valve performance data analytics can reveal patterns that drive process improvements and cost savings.
Best Practices for Implementing Valve Monitoring Solutions
Adopting digital dashboards requires careful planning and collaboration. Consider these best practices:
- Conduct a needs assessment to identify critical valves and data points
- Choose scalable platforms that support future expansion and integration
- Involve end-users in the design process to ensure intuitive interfaces
- Establish clear protocols for responding to alerts and anomalies
- Regularly review dashboard performance and update configurations as needed
By following these steps, organizations can maximize the return on investment and foster a culture of continuous improvement.
Enhancing Operator Decision-Making with Visualization Tools
Visual representation of valve data is a powerful aid for plant operators. Dashboards often incorporate color-coded indicators, trend lines, and interactive maps to make complex information easy to interpret at a glance. For those interested in exploring further, valve condition visualization tools offer specialized features for rapid status assessment and troubleshooting.
Effective visualization reduces cognitive load, shortens response times, and minimizes the risk of human error—especially in high-pressure environments.
Industry Applications and Use Cases
While the core principles of valve oversight apply across industries, specific requirements may vary. Common applications include:
- Oil and gas: Monitoring critical shutoff valves and pressure relief systems
- Chemical processing: Ensuring compliance with safety and environmental regulations
- Power generation: Managing steam and cooling water flows for efficiency
- Pharmaceuticals: Maintaining precise control in sterile production environments
In each case, digital dashboards help operators maintain control, reduce downtime, and ensure product quality.
Challenges and Considerations
Implementing and maintaining monitoring solutions is not without challenges. Common hurdles include:
- Integrating legacy equipment with modern digital platforms
- Ensuring cybersecurity and data integrity
- Managing the volume and complexity of data streams
- Training staff to interpret and act on dashboard insights
Addressing these issues requires a combination of technical expertise, robust IT infrastructure, and ongoing training programs.
Further Reading and Industry Resources
For a deeper dive into specific monitoring techniques, the article on reciprocating compressor suction and discharge valve monitoring provides valuable technical insights. Staying informed about industry developments ensures that your plant remains at the forefront of operational excellence.
FAQ
What are the main benefits of using valve monitoring dashboards?
These platforms provide real-time visibility, early warning of potential issues, and centralized access to diagnostic and maintenance data. They help reduce unplanned downtime, improve safety, and support data-driven decision-making.
How do these dashboards integrate with existing plant systems?
Modern solutions are designed to connect with SCADA, asset management, and analytics platforms. This integration ensures seamless data flow and a unified view of plant operations.
Can dashboards help predict valve failures?
Yes, when combined with predictive analytics and anomaly detection models, dashboards can identify early signs of wear or malfunction, allowing for proactive maintenance and reduced risk of unexpected failures.