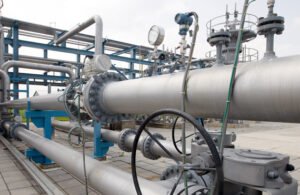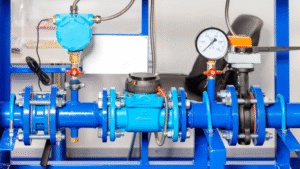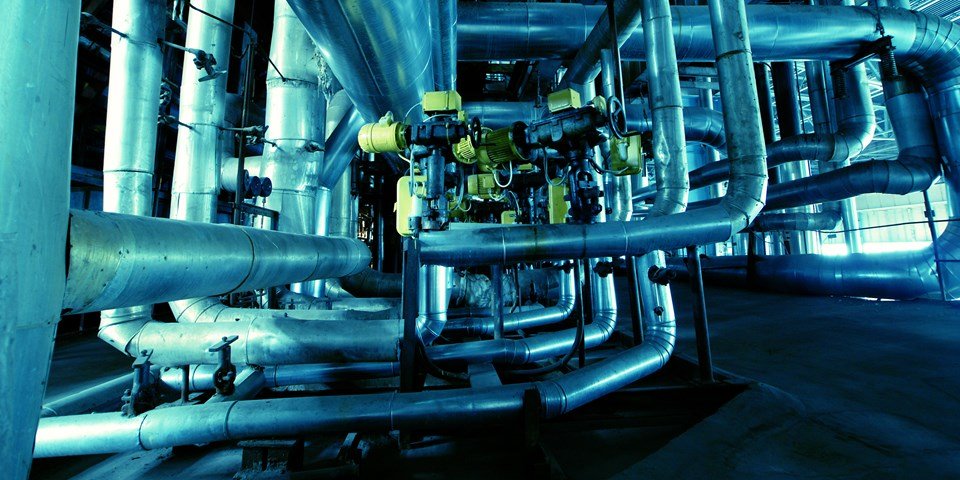

Modern industrial plants rely on thousands of valves to regulate flow, pressure, and safety across complex systems. Keeping these critical components in optimal working order is essential for operational efficiency, safety, and compliance. Valve condition visualization tools have emerged as a transformative solution, enabling plant operators to monitor, assess, and act on valve health in real time. These digital platforms turn raw sensor data into actionable insights, helping teams avoid costly failures and streamline maintenance.
As digital transformation accelerates across process industries, the demand for smarter, more accessible valve monitoring has grown. Operators now expect intuitive dashboards, predictive analytics, and integration with broader plant management systems. This article explores the latest advancements in valve condition monitoring, the benefits for plant teams, and how these tools fit into a proactive maintenance strategy.
For those interested in leveraging predictive analytics, consider exploring valve anomaly prediction models to further enhance your maintenance approach.
Understanding Valve Condition Monitoring and Visualisation
Valve condition visualization tools combine hardware sensors, data acquisition systems, and software interfaces to provide a clear, real-time picture of valve performance. These systems collect information such as position, temperature, vibration, pressure, and flow, then present it through user-friendly dashboards and alerts.
Key features typically include:
- Live status indicators for open/closed/partially open positions
- Historical trends and performance graphs
- Alarm notifications for abnormal behavior or potential failures
- Integration with maintenance management systems
- Predictive analytics to forecast wear or malfunction
By visualizing this data, operators can quickly identify issues, prioritize interventions, and reduce the risk of unplanned downtime.
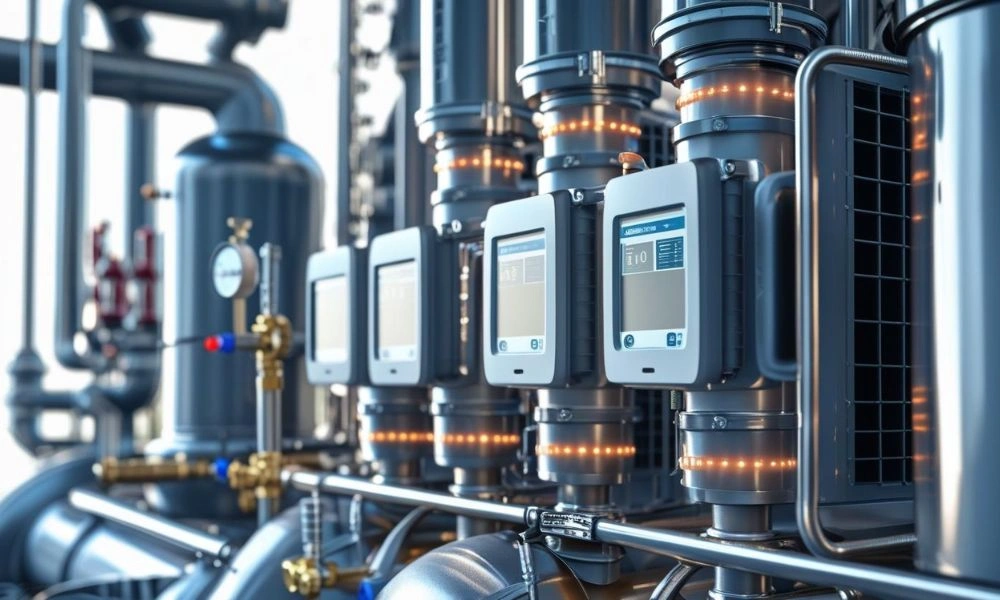
Benefits of Digital Valve Health Dashboards
The adoption of digital dashboards for valve health brings several advantages to plant operations:
- Faster Issue Detection: Visual cues and alarms highlight abnormal valve behavior, enabling immediate response.
- Reduced Maintenance Costs: Early detection of wear or leaks allows for targeted repairs, minimizing unnecessary replacements and labor.
- Improved Safety: Real-time monitoring helps prevent hazardous situations caused by stuck or failing valves.
- Data-Driven Decisions: Historical data and analytics support smarter planning and resource allocation.
- Remote Accessibility: Cloud-based platforms allow teams to monitor assets from anywhere, supporting distributed or multi-site operations.
These benefits are especially valuable in industries such as oil & gas, water treatment, power generation, and chemical processing, where valve failures can have significant operational and safety consequences.
Key Features to Look for in Valve Condition Visualization Platforms
Selecting the right monitoring solution depends on your plant’s unique requirements, but several features are essential for effective valve management:
- Customizable Dashboards: The ability to tailor views for different user roles or asset types improves usability and focus.
- Integration Capabilities: Seamless connection with existing SCADA, DCS, or CMMS systems ensures data flows where it’s needed.
- Predictive Maintenance Tools: Advanced analytics, such as those found in valve performance data analytics, help forecast failures before they occur.
- Mobile Accessibility: Support for tablets and smartphones enables field teams to access information on the go.
- Scalability: The platform should handle growth in asset count and data volume without performance loss.
When evaluating solutions, consider the ease of deployment, ongoing support, and the vendor’s experience in your specific industry.
How Visualization Tools Support Proactive Maintenance
Traditional maintenance approaches often rely on fixed schedules or reactive repairs after a failure. By contrast, valve condition visualization tools enable a shift toward proactive and predictive maintenance. Operators can spot early warning signs—such as increased vibration, slow actuation, or pressure anomalies—long before a valve fails.
This approach reduces emergency shutdowns, extends asset life, and optimizes spare parts inventory. It also supports regulatory compliance by providing auditable records of valve health and maintenance actions.
Integration with Broader Plant Systems
For maximum impact, visualization platforms should not operate in isolation. Integration with plant-wide systems—such as SCADA, DCS, and enterprise asset management—ensures that valve data informs broader operational decisions. For example, insights from water distribution valve monitoring can be combined with pump and flow data to optimize network reliability.
Some advanced solutions also support automated control, enabling the system to adjust valve positions in response to changing process conditions. This level of automation is a key step toward intelligent plant management.
Real-World Applications and Industry Examples
Industries across the globe are leveraging these tools to improve reliability and efficiency. In the oil and gas sector, monitoring valve health is critical for preventing leaks and ensuring safe transport of hazardous materials. Water utilities use visualization platforms to maintain consistent supply and quickly address distribution issues. Power plants rely on real-time valve insights to manage steam and cooling systems, reducing the risk of costly outages.
For a deeper dive into compressor valve monitoring, see this comprehensive article on reciprocating compressor valve monitoring and its impact on operational efficiency.
Challenges and Considerations for Implementation
While the advantages are clear, implementing a new visualization platform requires careful planning. Common challenges include:
- Ensuring compatibility with legacy equipment and data protocols
- Managing cybersecurity risks, especially with cloud-based solutions
- Training staff to interpret data and respond appropriately
- Balancing upfront investment with long-term ROI
A phased rollout, starting with critical assets and expanding as value is demonstrated, can help manage these challenges and build internal support.
Future Trends in Valve Monitoring Technology
The evolution of valve condition visualization tools continues, with several trends shaping the future:
- Artificial Intelligence: Machine learning models are being used to detect subtle patterns and predict failures with greater accuracy.
- Edge Computing: Processing data closer to the source reduces latency and bandwidth requirements, enabling faster response times.
- Wireless Sensors: Advances in battery life and connectivity are making it easier to retrofit existing valves with minimal disruption.
- Augmented Reality: Some platforms are experimenting with AR overlays, allowing technicians to visualize valve health data through smart glasses or mobile devices.
As these technologies mature, plant operators will gain even greater control and insight over their valve assets.
Frequently Asked Questions
What types of data do valve visualization platforms typically display?
Most platforms present real-time and historical data on valve position, temperature, vibration, pressure, and flow. Some also include maintenance history, alarm logs, and predictive analytics to help forecast potential issues.
How do these tools improve plant safety?
By providing instant alerts and visual cues for abnormal valve behavior, these systems help operators respond quickly to potential hazards, reducing the risk of leaks, spills, or equipment damage.
Can visualization tools be integrated with existing plant systems?
Yes, most modern solutions offer integration with SCADA, DCS, and maintenance management platforms. This ensures that valve condition data is available to all relevant teams and supports coordinated decision-making.
Conclusion
Adopting advanced monitoring and visualization platforms is a practical step toward safer, more efficient, and more reliable plant operations. By turning complex sensor data into clear, actionable insights, these tools empower operators to make informed decisions, reduce downtime, and extend the life of critical assets. As technology continues to evolve, the role of digital valve monitoring will only grow in importance for industrial facilities worldwide.